Role
Product Designer & Developer
How do you keep SaaS revenue, retention, and customer operations tied to one source of truth?
Product Designer & Developer
SaaS Analytics
Web Dashboard
React + TypeScript
Tailwind CSS
Interactive Charts
Canonical Data Model
Vite · Git
Revenue Intelligence
Single Source of Truth
A dashboard is only as trustworthy as the model underneath it.
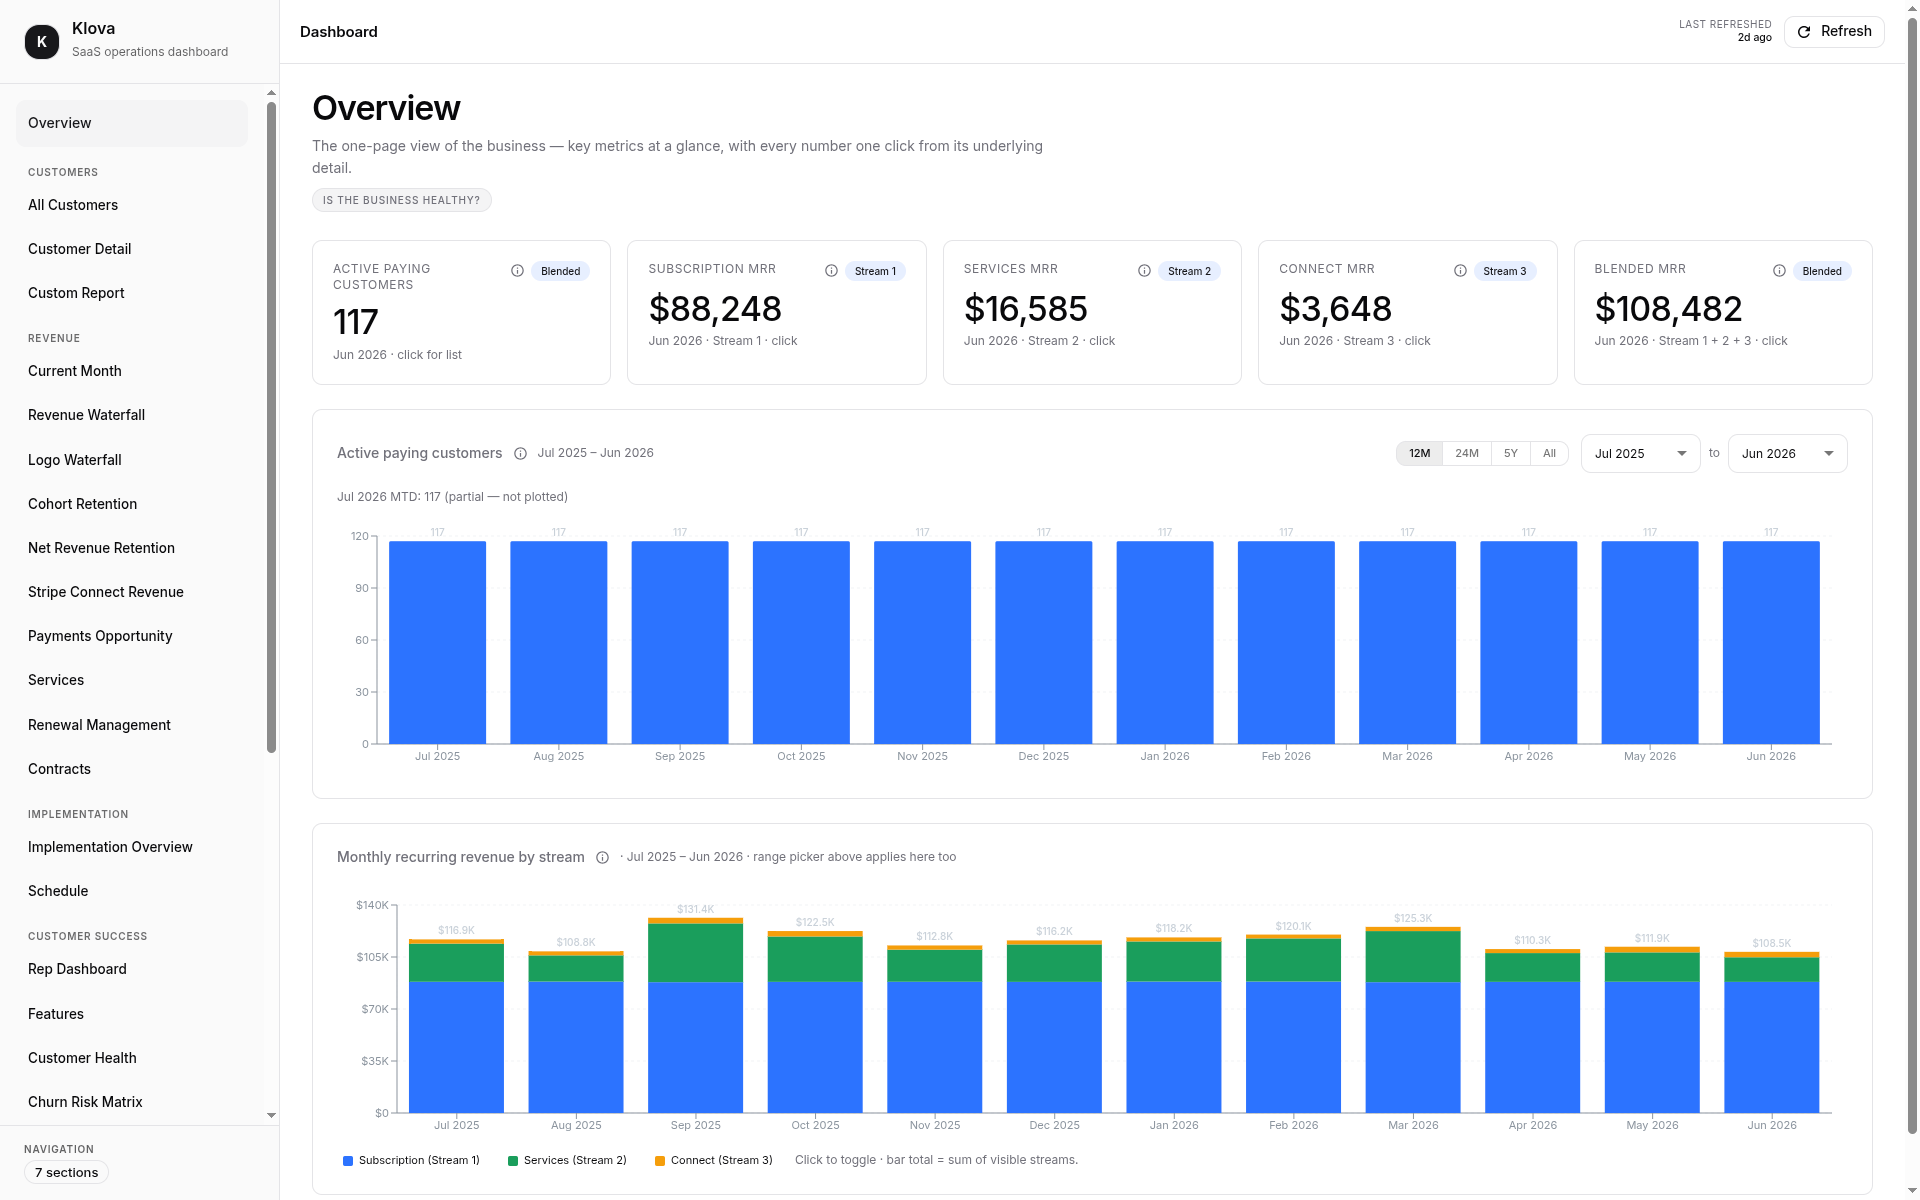
Most SaaS analytics products treat the dashboard as the product. Teams spend months refining charts, filters, and visual polish, yet the numbers behind those interfaces are often produced by independent queries, duplicated business logic, and disconnected data sources. When every report defines its own truth, a single source of truth becomes impossible.
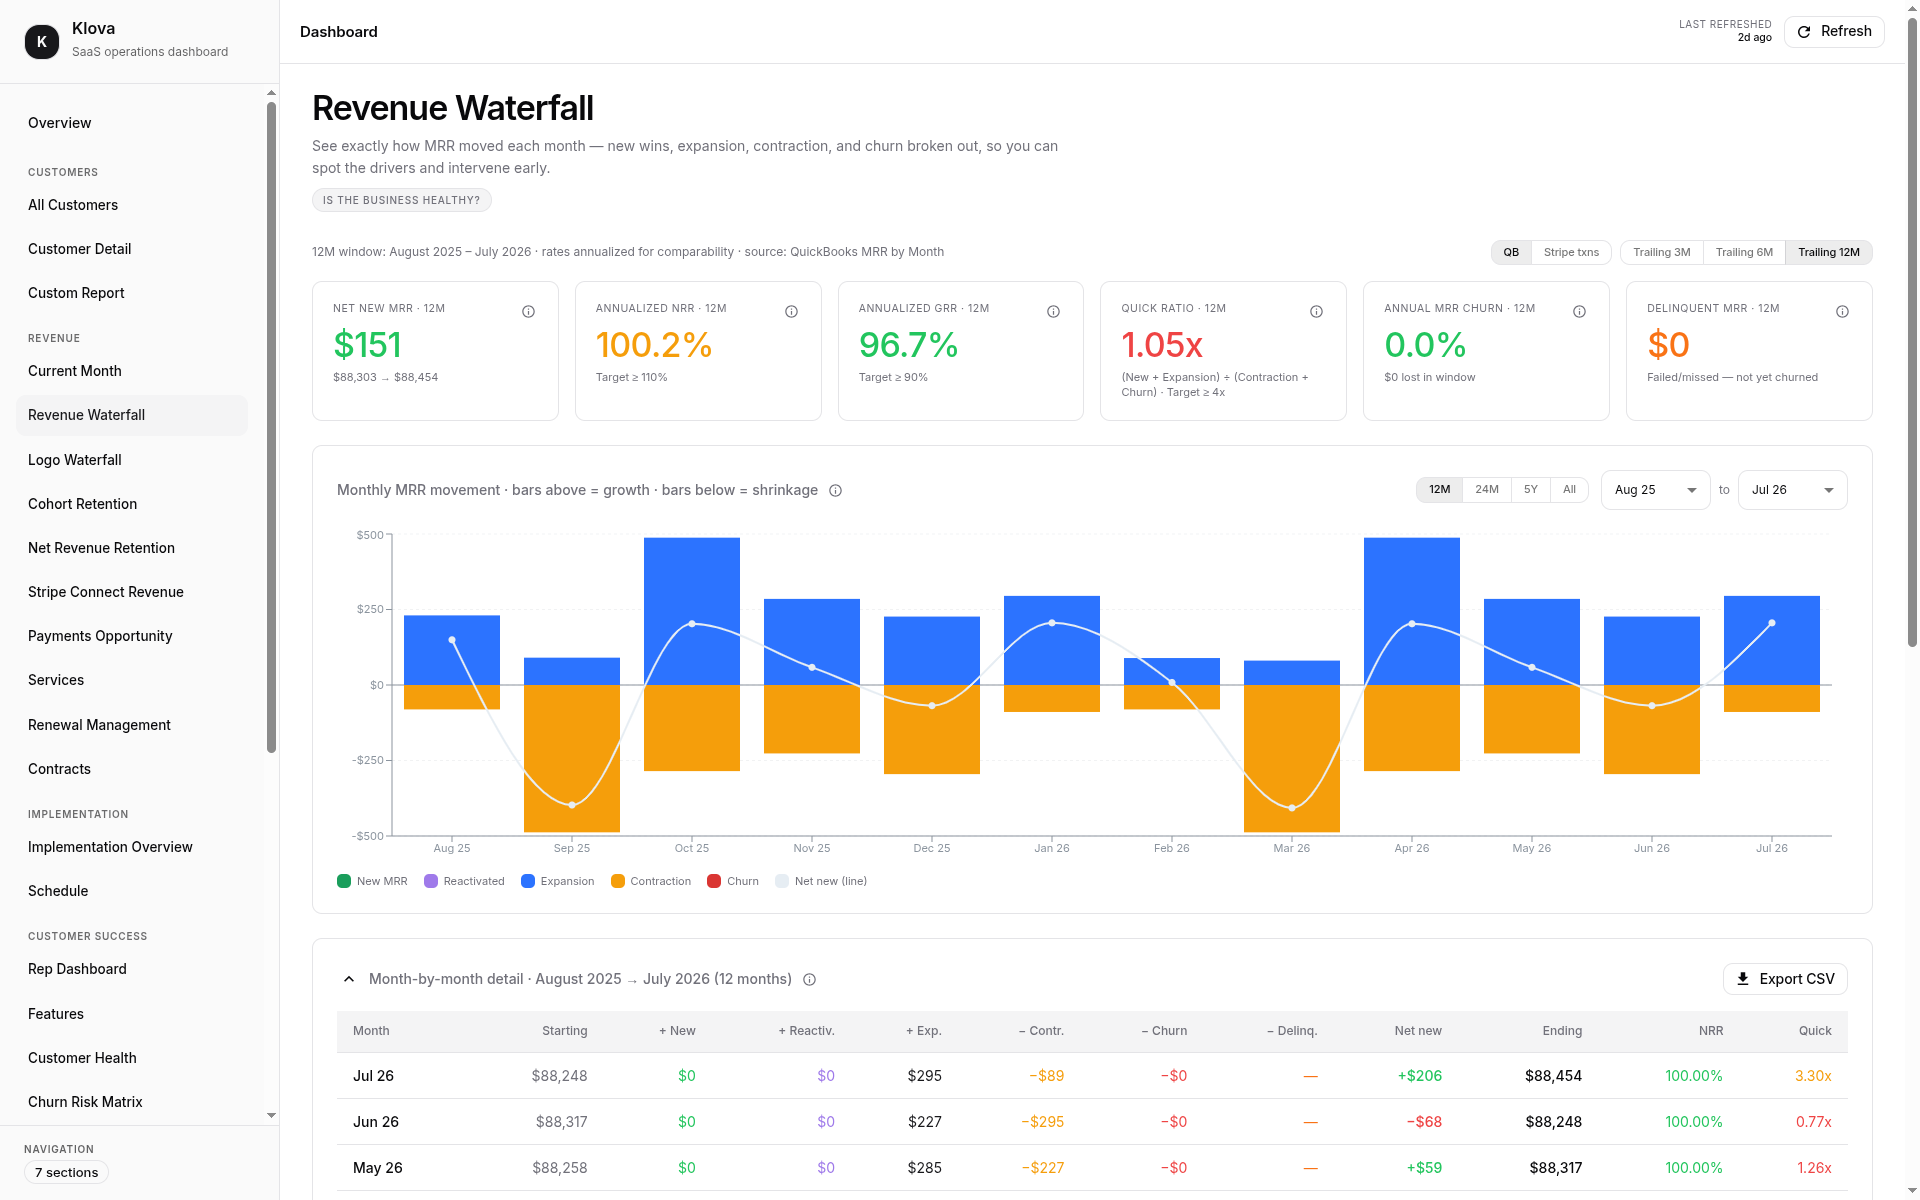
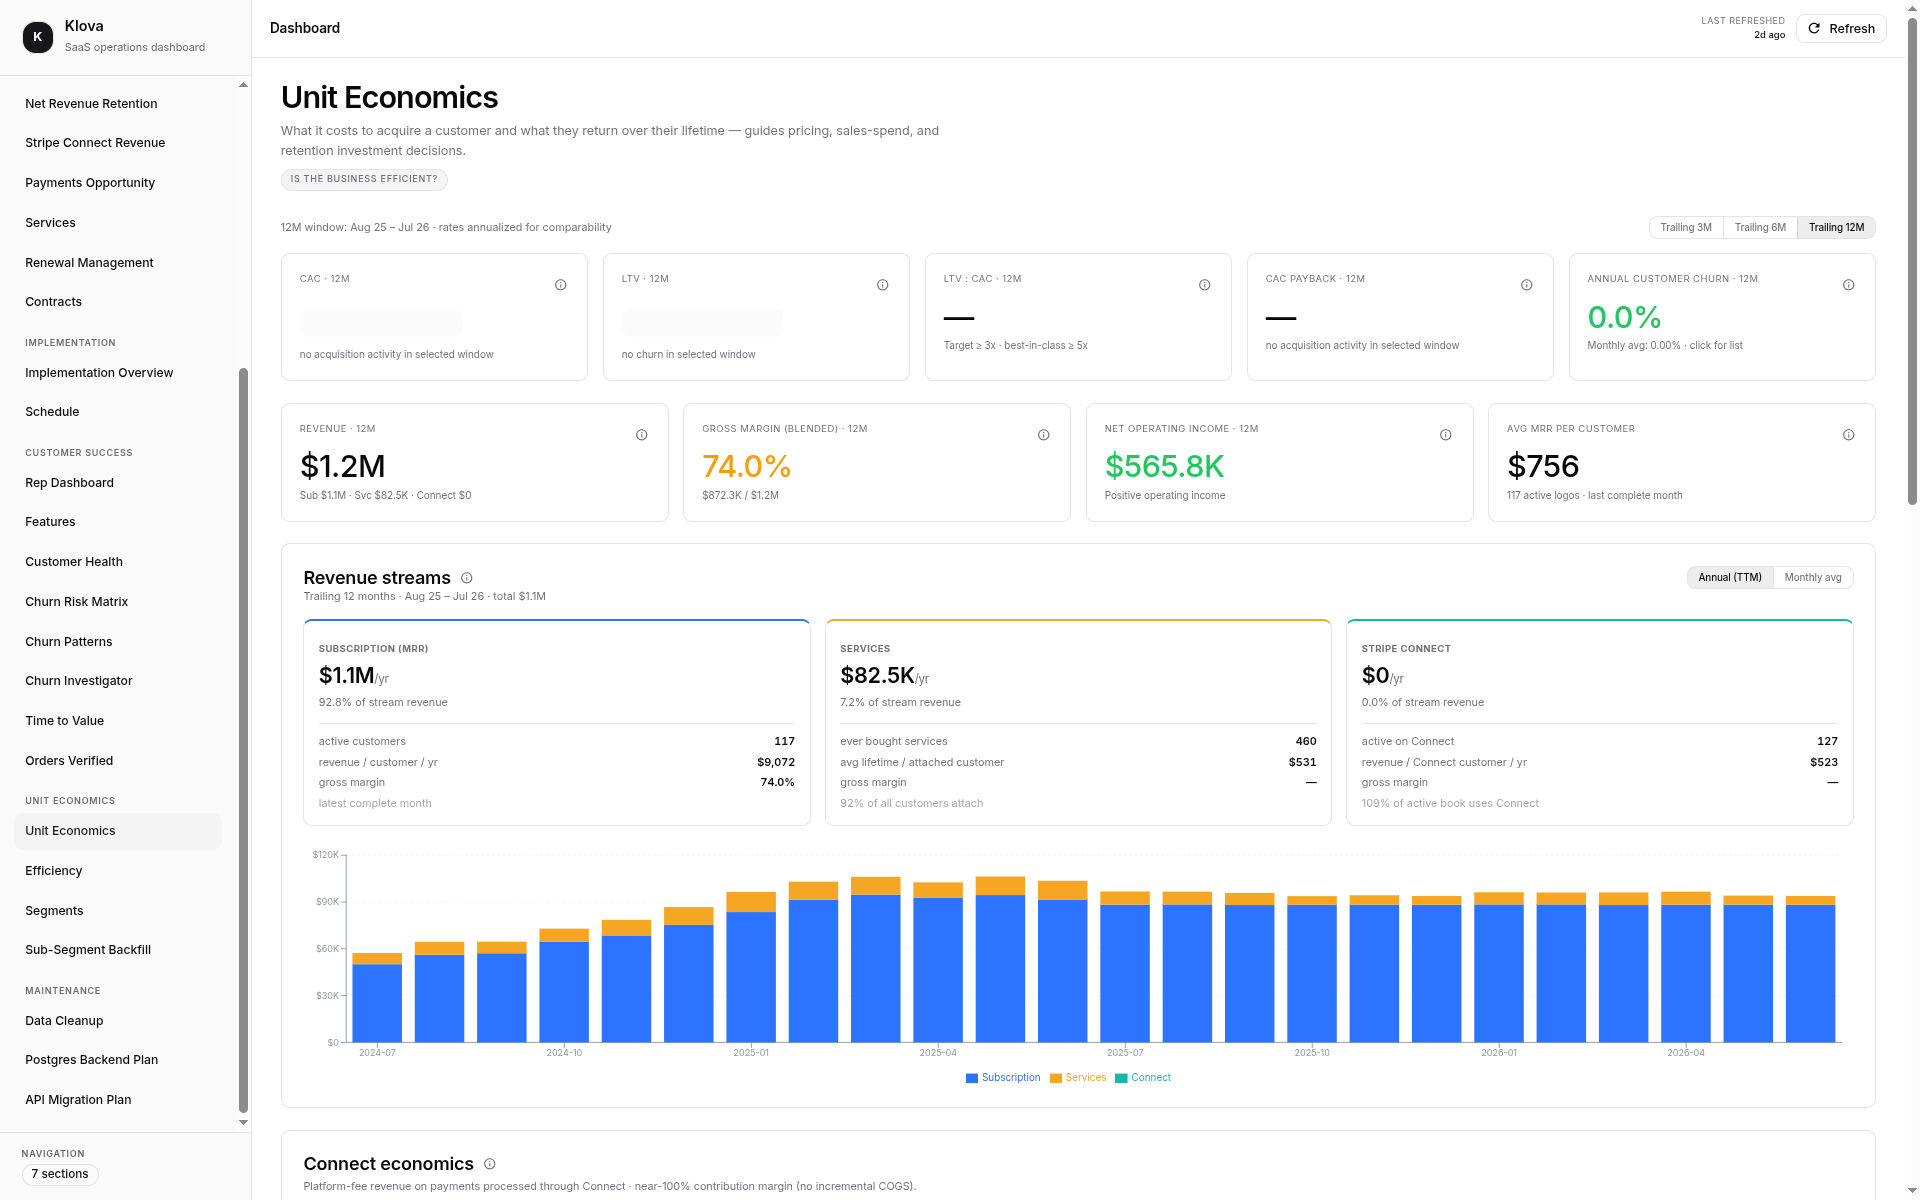
Klova was built from the opposite assumption. The dashboard should never decide what revenue, customer health, or retention means. Its responsibility is only to present information. The definition of those metrics belongs to a canonical model that transforms raw operational data into clarity — a deterministic representation of the business.
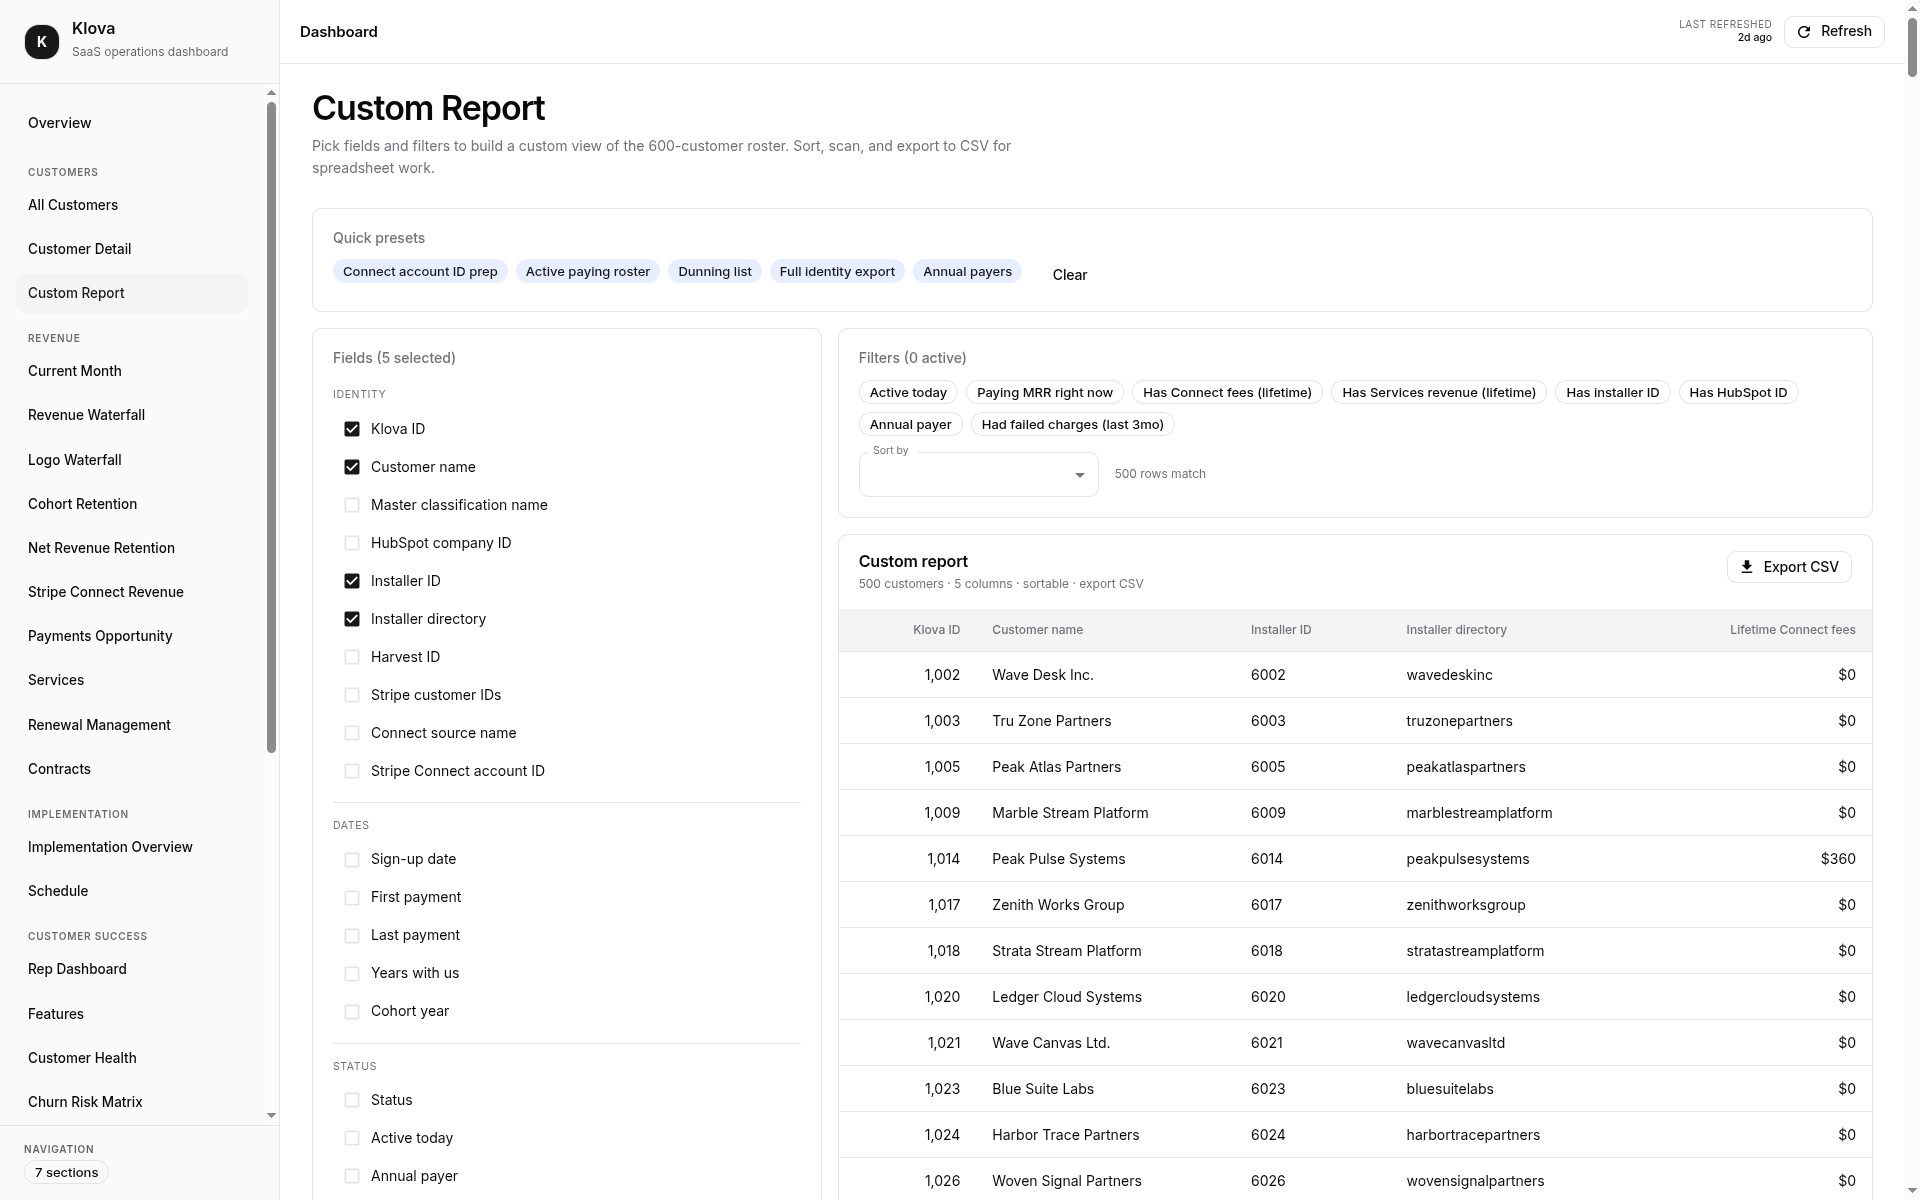
That distinction changes how the entire system is designed. Instead of every feature calculating its own numbers, every visualization consumes the same reconciled dataset. Revenue, subscriptions, customer identity, operational events, and lifecycle metrics all inherit their meaning from one modular foundation. The interface becomes thinner, while the underlying model becomes substantially more reliable. This approach also improves maintainability. New reports no longer require duplicating transformation logic or introducing another interpretation of existing metrics. As the product evolves, additional dashboards can be built on top of the same foundation without risking inconsistencies between teams or workflows.
Ultimately, the value of an analytics platform is determined less by how sophisticated its charts appear and more by how trustworthy its underlying data remains. Clear interfaces are important, but confidence comes from consistency. A dashboard should visualize reality — not redefine it.
Most SaaS analytics products treat the dashboard as the product. Teams spend months refining charts, filters, and visual polish, but the numbers behind those interfaces are often generated by independent queries, duplicated business logic, and disconnected data sources. When every report defines its own version of the truth, consistency becomes impossible.
Klova was built on a different principle. The dashboard should never decide what revenue, customer health, or retention mean. Its responsibility is to present information. The definition of those metrics belongs to a canonical model that transforms raw operational data into a single source of truth for the business.
That decision changes how the entire system is designed. Instead of every feature calculating its own metrics, every visualization consumes the same reconciled dataset. Revenue, subscriptions, customer identity, operational events, and lifecycle metrics all originate from one shared foundation. The interface becomes simpler while the underlying model becomes significantly more deterministic.
This approach also improves maintainability. New reports no longer require duplicated transformation logic or another interpretation of existing metrics. As the product evolves, additional dashboards can be built on the same foundation without introducing inconsistencies between teams or workflows.
Ultimately, the value of an analytics platform is determined less by how sophisticated its charts appear and more by how trustworthy its underlying data remains. Clear interfaces are important, but confidence comes from consistency. A dashboard should visualize reality, not redefine it.